
May 2, 2015
The OTC (over the counter) exchange is like the Wild West of stock trading. It’s below the big U.S. NYSE and NASDAQ markets and companies on the OTC have more lenient reporting standards.
After penny trading for a year with a start in April 2013, and practicing paper and virtual trading a year before that, I’ve developed a penny stock trading strategy called UPtrend. It means I trade upward price movements to garner gains while not short selling. The ultimate goal is to capture 20-50% gains, called the greed line, each trade.
This strategy suits those with cash trading accounts. The idea is to find tickers that will have an uptrend for a week+ allowing the trader to meet T+3 clearing.
This doesn’t mean you can’t use the UPtrend strategy to day trade. Charting analysis in the 5min/1day and 15min/5 day become critical as a day trader tries to garner quick gains. Criteria listed below would just need to change to shorter periods and more recent or rumor based hype.
UPtrend Strategy:
+ 2-3 day uptrend minimum
+ Recent PRs from company
+ TA with PSAR of buy signal, 30+ ADX with +DM above -DM, and CCI above 0 or oversold below -100.
+ Positive ticker board presence on social trading mediums like iHub.
QBs are generally audited and have recent financial filings. I find QBs to have less risk of loss versus Pink Sheet tickers while still seeing quick results. I’ll want to hold an OTC ticker no longer than a month, because OTC ticker’ time moves faster than with ANN penny stock tickers.
I feel trading tickers with these minimum requirements hedges my trading risk for losses. Towards the end I discuss additional DD I may perform to feel better about my trade.
Strategy In-Depth
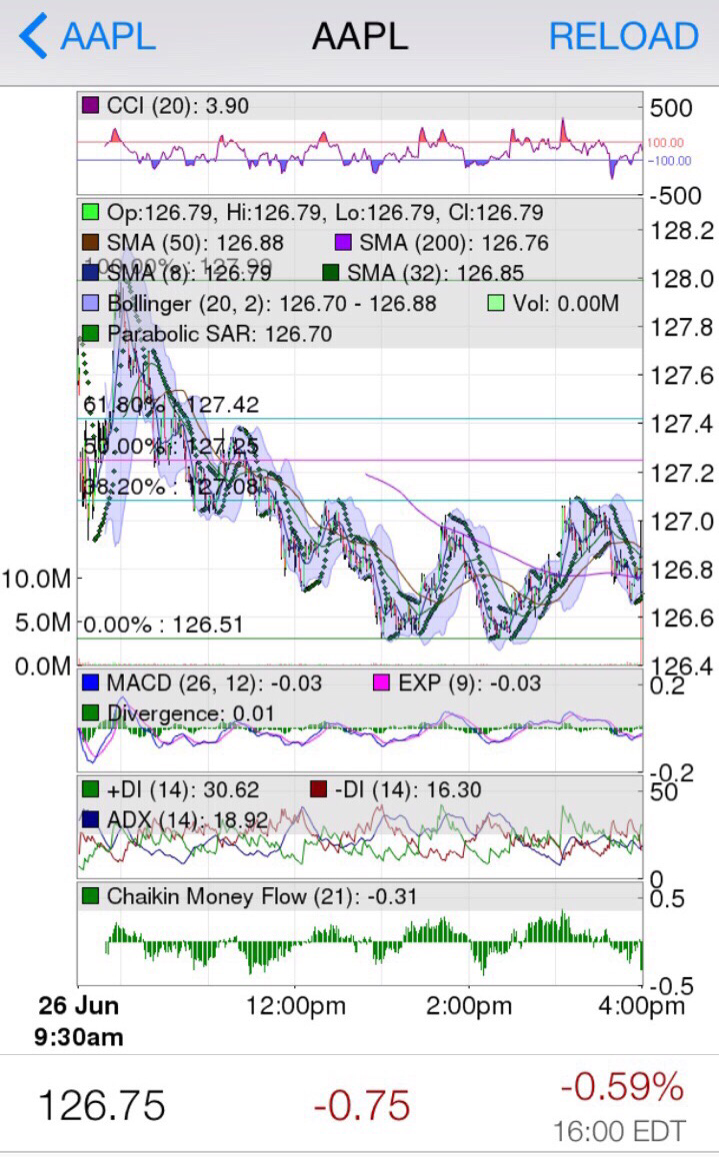
UPtrend Chart
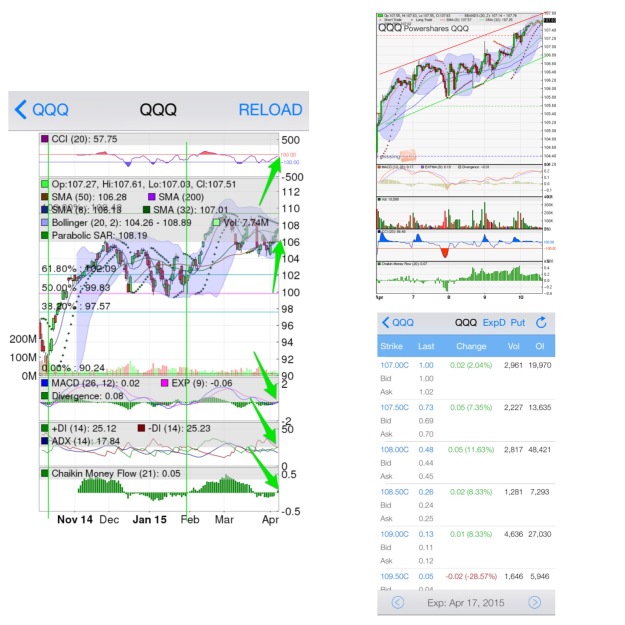
Here’s an example of possible UPtrend charts:
 Charts are from 5/1/15
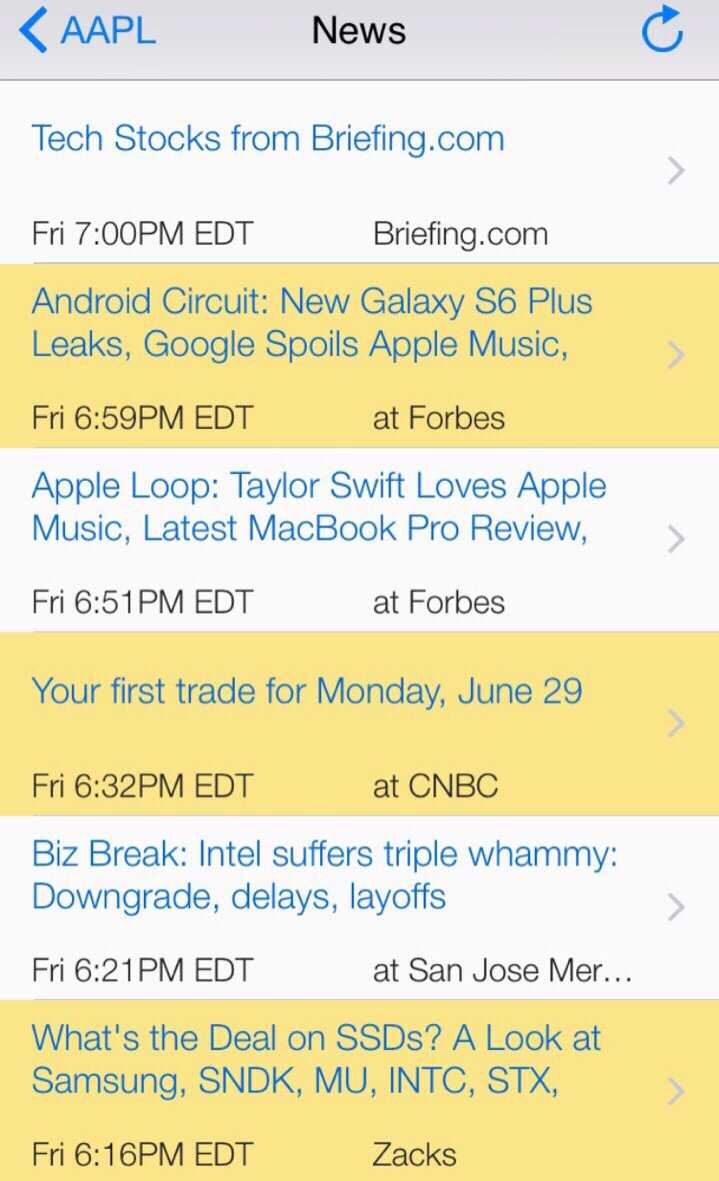
News and PRs
A great resource for PR search is Quote Media. We’ll use $MNTR as an example ticker to research. MNTR was an OTC QB ticker I traded in 2013 during my winning streak. I saved my notes and will use in analysis here. Do a ticker search and get: $MNTR news.
Because no Revenue has been filed yet we want to read PRs for indications of Revenue in the future. The PRs issued in 2014 indicate 60% of Bhang Chocolate was acquired for $39 million value and $5 million was acquired as a line of credit. An Internet search on Bhang Chocolate reveals Revenue being generated through chocolate sales. MNTR also announced MMJ industry funding will be had by issuing preferred shares at $7/share, and naked short selling issues as an explanation for the pps correction.
The news is very rosy for Mentor Capital.
TA Cheat Sheet
I’m going to add a quick cheat sheet of momentum and other indicators and the values I expect. First, you need to know what oversold and overbought mean. Oversold means chart indicators are pointing to too many traders have sold and the trend will reverse soon. Overbought means the opposite with too many buyers having bought making the pps uptrend unsustainable with correction expected soon. Some use only 1 or 2 indicators solely, while I like to use many for a “stars align” feeling.
I mainly utilize PSAR, DMI with ADX, and CCI TA indicators to save time.
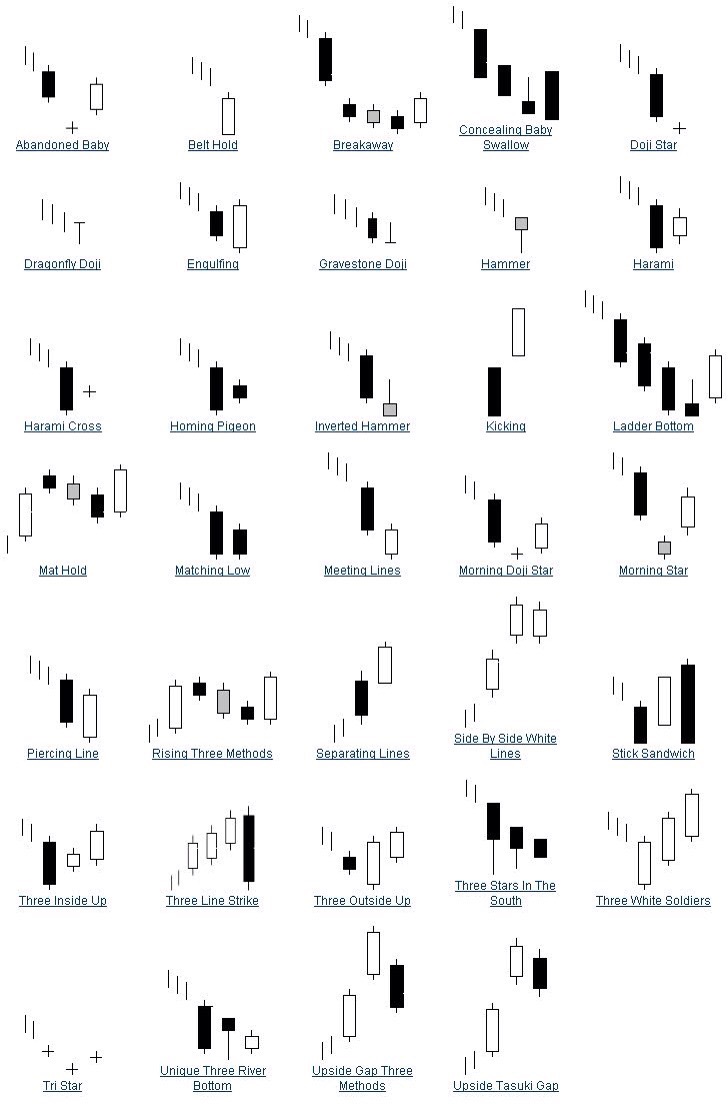
Candlestick pps presentation shows the opening and closing pps info as well as the day’s pps range.
Volume. It is said volume proceeds price, unless everyone is selling…
MA = Moving average. You want a smaller day MA to be crossing or over a larger day MA. Such as the 8MA over the 32MA.
BBs = Bollinger Bands. The tighter the bands the more it is expected a pps uptrend will occur. Pps candles trading above the dotted neutral line is bullish (buy) while riding below is bearish (sell). Pps candles riding above the upper BB means overbought. Pps candles riding below the lower BB means oversold.
PSAR = Parabolic SAR. A PSAR dot below a pps candle signals buy while a dot above signals sell.
Ichimoku Cloud = pps estimated movement. Pps candles above clouds signals buy, below clouds signals sell, and riding in clouds signal flat trading estimation. Green clouds are based on 26 and 9 MAs and move faster than red clouds which are based on 52 week MAs. Cloud movements of green (support) and red (resistance) can note trend reversals. This is a complex overlay that a trader could devote trades solely off of.
ADX/DMI = Average Directional Index with Directional Movement Indicator. A more sophisticated indicator, ADX tells a chartist if a trend is weak (below 30) or strong (above 30) while making sure the +DM is on an uptrend and above the -DM to signal a buy trend.
CCI = Commodity Channel Index. Values above 0 signal buy. Oversold is a value below -100 while overbought is signaled with values above +100.
RSI = Relative Strength Index. Values above 50 mean buy. Values above 70 mean overbought while values below 30 signal oversold.
CMF = Chaiken Money Flow. Bars above the neutral line signal buyer pressure while bars below signal seller pressure.
MACD = Moving Average Divergence/Convergence. Looking for the MACD line to be above the MA line and rising above the threshold bars signals a strong ow Index. Values above 50 mean buy. Values above 80 mean overbought while values below 20 signal oversold.
OBV = On Balance Volume. Said to indicate large buying volume. This indicator should be uptrending to signal many buyers are holding versus selling occurring. Similar to Acc/Dist.
ROC = Rate of change. Basically, an uptrend above 0% signals buyer pressure.
The general rule I use with all of these indicators is to see an UPtrend in the lines or trend lines, except PSAR. You will want to look at charts from 3-Month and 6-Month to see how strong the trends have been in the past with a chart to isolate those indicators that haven’t been reliable in the past periods.
I recommend becoming very familiar with each chart indicator one at a time. As you become familiar with each you can utilize more or less according to historical trends, your comfort level, and various situations such as news springing from the company. A few situations will render chart reading obsolete for a day or week: A large group is alerted to enter a ticker; the company issues positive business news; a major contract is signed; a large shareholder decides to exit; and etc.
Here are a series of 6-Month charts on MNTR with my TA from the cheat sheet above.
This first chart shows a 200 and 50 MA with PSAR overlay over a candlestick chart. RSI, MACD, CMF, and volume are included. On 1/21/14 you can see the 50 MA crossed above the 200 MA, and the pps went on a strong uptrend.
The PSAR has been a good indicator of buy over the mid-term despite mini pps corrections along the uptrend from 1/21 to 3/14/14. The PSAR can lag a day or two as evidenced by the PSAR dots above the candles 3/14 when the downtrend really started 3/17, but when PSAR moved up the candles the sell signal was right.
Note how the candles were just touching the 200 MA on 4/10/14, and this bounce off the 200 MA on 4/11 is a very bullish indicator.
The RSI signaled oversold with a value below 30 on 4/10/14. Notice the large candle on 4/11 with RSI uptrend starting. Historically, the RSI has been a good indicator of oversold as the pps corrects temporarily each time it hits 70 along the pps uptrend from 1/21 to 3/14.
MACD came alive 1/21/14 with a large pps spike shown in the large candle body. You can see MACD was signaling overbought around the time the pps corrected on 3/14 as the MACD line hit 1.5. Note the sharp MACD line dip below the red MA line on 3/17 which indicated a strong sell signal. MACD just starts to spike upward on 4/11 but caution of a sustained pps uptrend until MACD is above the threshold bars.
CMF has been below the neutral line since 3/17/14. Notice how CMF is starting to return to the 0 line on 4/11. A cross above the 0 line would be bullish.
<a href=”http://tinypic.com?ref=33k8zgi” target=”_blank”><img src=”http://i61.tinypic.com/33k8zgi.jpg” border=”0″ alt=”Image and video hosting by TinyPic”></a>
The second chart keeps the 200 and 50 MA overlay but BBs, Acc/Dist, MFI, and OBV have been added.
The BBs have been wide mainly, even before the pps jumped above $1. A switch to the Nov 13′ through mid Jan 14′ would show BBs wider than including in a chart with large change in pps. Between 2/10-2/24 you can see the BBs were at the tightest and the result was a nice pps breakout from 2/24-3/17. The candles never dropped below the lower BB to signal oversold before the 4/11 pop.
Acc/Dist has been following the pps trend. Notice the sharp decline on 3/17/14 however. This could have been telling in regards to the pps downtrend from 3/17 to 4/10.
OBV has followed the pps trend as well, though not as sharply. This is inherent in the averaging used in the OBV line plotting. Large volume changes would effect OBV more drastically such as on 2/24 and 4/11. Notice how Acc/Dist predicted the pps correction before OBV, but both predict the downtrend nonetheless.
MFI has been a good predictor of overbought on this 6-Month chart, but not of oversold. Notice on 4/1 and 4/7 how the MFI was below 20 yet the pps just traded sideways instead of uptrending. This is one reason I check the historical trending of an indicator before relying heavily on it.
<a href=”http://tinypic.com?ref=205pk78″ target=”_blank”><img src=”http://i61.tinypic.com/205pk78.jpg” border=”0″ alt=”Image and video hosting by TinyPic”></a>
The third chart adds the 8 and 32 MA as well as the Ochimoku Cloud overlay, ADX/DMI, CCI, and more clear volume bar set.
Notice how the pps candles cross below the 8 MA on 3/17/14 before majorly correcting for a few weeks. This was a major bearish signal. It’s not until 3/30 that the 8 MA drops below the 32 MA, and if a trader wasn’t out by then it was definately signaling get out then. Like the 50 and 200 MA, the 8 and 32 MA signaled buy on 1/20.
The Ochimoku Cloud was predicting support between 4/4-4/7, but the candles break below the cloud triggered a sell signal. I feel in this chart the Ochimoku Cloud loses it’s estimation ability until the next correction on 4/11 plays out longer.
The ADX/DMI had signaled buy on 1/21 when the ADX began a strong uptrend and the +DM crossed above the -DM. Between 1/21 to 3/17 the +DM stays above the -DM with a pretty consistent 30 ADX line signaling a strong trend. By 3/17 the +DM dips below the -DM and the ADX line dips signaling trend reversal (sell). On 4/11 the ADX/DMI signal are attempting to become clearer but it is too soon to read exactly what signal will prevail- buy or sell is confused due to lines meeting.
The CCI has been a fairly good indicator of overbought and oversold. Notice more extreme values past 100 and -100 have predicted pps changes. CCI has followed closely with pps movements. Between 4/9 to 4/11 the CCI signaled oversold and the 4/11 bounce wasn’t surprising.
The clearer volume bars show what was described earlier- strong interest has been in this ticker since the $1 crossing.
<a href=”http://tinypic.com?ref=26ubl” target=”_blank”><img src=”http://i61.tinypic.com/26ubl.jpg” border=”0″ alt=”Image and video hosting by TinyPic”></a>
The final fourth chart adds the 10 and 50 MAs, price change, ROC, and Williams R.
Just like the other MAs noted before, the 10 MA crossed above the 50 MA on 1/21/14 and fell below on 3/17. The candles fell below both MAs 4/1 which was a very bearish signal.
ROC was sporadic in the first pps spike around 1/21/14. Since, it has moved slightly with the pps uptrend, downtrend, and then spike on 4/11. You generally want to see ROC above 0% for a buy signal.
The other two indicators I place as filler indicators.
<a href=”http://tinypic.com?ref=28bwiux” target=”_blank”><img src=”http://i58.tinypic.com/28bwiux.jpg” border=”0″ alt=”Image and video hosting by TinyPic”></a>
I haven’t touch on support and resistance yet, so here it is quickly. Support is the general pps where a downtrend can be halted, as chart history or MAs show. Resistance is the pps needed to be broken to allow an uptrend to continue. MNTR’s support appears to be $1.40-$1.50 and resistance at $3.91. Breaking above MAs at this point would be other resistances.
If you’re short on time to create and analyze charts there are two other options I have tested to be fairly accurate in the short-term: Barchart and American Bulls.
Barchart offers free trader resources, TA, financial analysis (FA) and other features and scanners. A mobile app is also available. Here’s MNTR’s analysis:
<a href=”http://www.barchart.com/opinions/stocks/MNTR”>16% Buy overall; 0% hold short-term; 25% buy mid-term; and 67% buy long-term</a>.
American Bulls use strictly candlestick analysis and offers free candlestick training. Here’s MNTR’s analysis:
<a href=”http://americanbulls.com/members/SearchList.aspx?lang=en&SearchText=MNTR&PageChoice=Confirmation”>Not available</a>.
Unfortunately, not all tickers are analyzed.
iHub Ticker Board Positive Sentiment
I like to read the iHub ticker board and search for top board status to see how much positive or negative buzz surrounds my prospect ticker. Sure many lie in anonymous posts online but many show their motivation.
<br /><br /><a href=”https://pennymann.files.wordpress.com/2014/04/20140413-211855.jpg”><img src=”https://pennymann.files.wordpress.com/2014/04/20140413-211855.jpg” alt=”20140413-211855.jpg” class=”alignnone size-full” /></a>
The MNTR ticker board on iHub shows a general long-term sentiment. DD is in the intro box and stickies. iHub also offers news related to MNTR it has captured:
<br /><br /><a href=”https://pennymann.files.wordpress.com/2014/04/20140413-212000.jpg”><img src=”https://pennymann.files.wordpress.com/2014/04/20140413-212000.jpg” alt=”20140413-212000.jpg” class=”alignnone size-full” /></a>
Summary
These criteria generally reduce my loss risk. A chart uptrend of 2-3 days allows more optimism of a continued uptrend. Company news keeps traders motivated for a successful future, so regular PRs are a must. TA showing buy signals helps show buyer sentiment and allow estimation of the better entry and exit. A positive trader sentiment on the ticker board aids me in knowing if enough traders are interested in a continued buying behavior.
Here are additional DD and analysis I may perform to feel better about a trade:
Current OTC/SEC Filings With Revenue
Search OTC Markets for your target ticker’s OTC filings:
<a href=”http://www.otcmarkets.com/stock/MNTR/filings”>MNTR OTC Filings</a>
Note MNTR hasn’t filed SEC filings since 1998. If SEC filings were filed you could search here:
<a href=”
https://www.sec.gov/edgar/searchedgar/companysearch.html”>SEC Company search</a>
Does MNTR show Revenue in the 2/28/14 filing? You have to look in the Income Statement here:
<a href=”https://www.otciq.com/otciq/ajax/showFinancialReportById.pdf?id=117601″>MNTR 2/28/14 Interim Financials</a>
MNTR doesn’t have Revenue yet, despite showing $40 million in assets and liabilities with a ($500)k deficit! At this point I would watch this target or search news for hints of Revenue occurring or about to occur through contract announcements, product/service offerings, or company updates that state Revenue is occuring and the filing is coming soon to verify. Filings take months to be available and the OTC/SEC has set windows to report quarterly info for the company to be in compliance for financial reporting.
MRIB is an example ticker I’ve traded that didn’t show Revenue in the filings. However, company PRs and CEO interviews showed multiple contracts signed pointing to Revenue to occur with their vodka sales at the time.
Momentum and other TA Indicators Pointing To Buy
TA stands for chart technical analysis. Chart reading can aid you in seeing whether buyers or sellers are more interested in your target ticker over a set time frame. Please see my stockcharts.com blog post for this free great resource to learn and do charting.
High Trending Volume
Note on the chart above the high volume trend. I want to make sure enough interest has been shown for my shares purchased to be exited in the future without the need for selling over several days. If a company is issuing PRs regularly this volume check shouldn’t be as important.
Dilution
To search for dilution you first start with the company share structure (SS). OTC Markets or the state a company is incorporated in will have this info.
<a href=”http://www.otcmarkets.com/stock/MNTR/profile”>OTC Markets MNTR Company Profile</a>
SS shows as: 400 million a/s a/o 9/30/13; 10.1 million o/s a/o 2/28/14; and 2.2 million float a/o 2/28/14.
Note: The Balance Sheet or Statement of Owners Equity sometimes shows the SS info also.
MNTR’s company shows the company incorporated in CA. The fins will discuss this also.
<a href=”http://kepler.sos.ca.gov”>CA SOS (Secretary of State) Company Search”</a>. The CA SOS has other corporate info besides legal name, address, and officers in another search. Shareholder info isn’t required to be filed in CA.
The next step is to contact the transfer agent (TA), MC Transfer, shown at OTC Markets in the Company Profile. MC Transfer will probably disclose the a/s and o/s unless Mentor Capital has gagged, to not disclose info, the TA. If the TA is gagged then the company would have to be reached for this info.
Once the current float, o/s, and a/s are known then dilution can be investigated in the volume in charts or by viewing the L2 over a few days to see which market makers (MMs) are leading the Ask with 10k shares consistently. MNTR’s volume has been 1 million shares traded on highest volume days since 1/21’s pps spike above $1. The high volume days have been about 4 with about 10 days above .5 million traded. Total is about 11 million shares traded and pin pointing exact sells versus buys is almost impossible. At 11 million total trades shares my opinion would be the 10.1 million o/s displayed a/o 2/28/14 hasn’t increased much. Dilution would have to be viewed on the 1-year chart via volume overall.
This company had added free L2 viewing at OTC Markets, a rarity for a Pink Current status:
<a href=”http://www.otcmarkets.com/stock/MNTR/quote”>MNTR L2</a>
If you wanted to have decent looking basic DD posts to spread the word then DDNotesMaker might inspire you. DDNotesMaker also offers a buzz board to see if your target ticker is being viewed a lot there. Here’s a link to see the buzz board and to ticker search:
<a href=”http://www.ddnotesmaker.com”>DDNotesMaker</a>
DD can take a much deep look and time investment. Further DD can include contacting the company, visiting the company, researching the company website and social media points, industry analysis, company comparisons, financial statement ratio analysis, and etc. most penny stocks aren’t worth this effort IMO.
Many TA techniques exist. I have chosen overlays and indicators I’ve studied, tested, and am comfortable using. Other blog posts I write, and to be written, will be focused on other TA techniques and individual traders with specific TA skills I’ve grown to trust.
Promo History
StockPromoters.com is the best free database of paid and unpaid promotions for penny stocks I’ve found so far. Here’s 1 unpaid promo shown on 2/7/14:
<a href=”http://stockpromoters.com/View-Stock-Promotions-By-Symbol.aspx?symbol=MNTR&ctl00%24ContentPlaceHolderyy%24Footer1%24Image2.x=-344&ctl00%24ContentPlaceHolderyy%24Footer1%24Image2.y=-199″>MNTR Promo History</a>
Promos don’t always show in general capture. Sometimes a trader who has many followers will alert a ticker and cause short-term interest. It can be difficult to know when a group of traders has been alerted to buy or sell.
I like to use Hotstocked.com as another source of free database search for paid or unpaid promotions. The researchers there also like to write articles that can offer a start to DD for your research. Here’s a recent article:
<a href=”http://www.hotstocked.com/article/79672/mentor-capital-inc-otcmkts-mntr-continues-to.html”>3/24/14 MNTR Hotstocked article</a>.
Hotstocked paints a suspect picture for MNTR, in their usual style, citing low fins for such large acquisitions and a low pps to be issuing preferred shares at $7/share.
8/6/14 Update
This update will show the results of MNTR since my 4/14′ UPtrend analysis. I never really gave an opinion to buy or sell as I wanted readers/traders to learn and make decisions on their own.
The elements of my UPtrend strategy were being met around 4/14′:
+ 2 day uptrend: met
+ Recent PRs from company: met
+ TA with PSAR of buy signal (below candles): met , 30+ ADX with +DM above -DM, and CCI above 0 or oversold below -100: wasn’t met.
+ Positive ticker board presence on iHub: met
However, there was one blaring red flag- dilution. The chart below shows the large increase in trading volume as company PRs and promises kicked on high gear. What remains is a pump and dump type chart, as explained in my other blog posts. The effects of dilution are powerful because as issued shares are sold buyer momentum slows and buyers begin to realize they aren’t winning the battle.
That’s my basic and comprehensive look into my UPtrend strategy and obtaining DD. I hope it helps you.
Happy trading!
Please note: This page is not an offer or solicitation to buy or sell securities or to provide my TA and FA ability. My hope is to give traders a free starting point to teach “how to fish” to improve trading skills for research, analysis, ticker selection, and entry and exit with risk estimations.


 Moving to a more complex cycle is the economic life cycle for various business industries. The idea is that our economy goes through periods of growth and decline as products, services, and business occur that spark consumer spending or lack thereof. The eleven basic industries are annotated and noted as to where most successful in the economic cycle.


