
December 19, 2014
Since I’ve been trading stocks, and recently options, I’ve been fascinated with trying to predict pps movement around a company’s reporting of eps and revenue for the last quarter. Why the appeal? Because a stock’s pps can see a great gain or loss around a company’s earnings announcement.
I tried trading a stock for the quick gain on going long or short after announcement a few years ago and had a win ratio less than 50%. Recently, I’ve been trading before announcement mainly with higher than 50% win ratio.
An earnings announcement strategy consists of trading stock or related options before and after an earnings announcement. This is a high risk strategy because many unknowns can occur that change a stock’s pps direction no matter how much research, analysis, and predictive models and calculations are done.
There are two points of trading in the earnings strategy: before and after company announcement. Both are high risk.
In the before announcement trade I try to gauge expectations of the announcement and trade with that direction. News and chart analysis helps predict expectations. Sometimes traders sell off before announcement and that alters an uptrend. Sometimes good news before announcement trumps a downtrend before announcement.
If a trader holds for announcement then there’s a 50/50 chance of the outcome of pop or crash. Being on the wrong side of the announcement can spell fast losses. Another element of holding after announcement is the company could give a future outlook update that trumps the results given. This makes holding after earnings more risky then just trading before announcement.
To lower risk with the earnings announcement strategy I research each ticker’s volume, chart indicators, and option volume to see whether a before announcement trade is worthy. Holding after earnings announcement is simply a 50/50 proposition and deep research may not uncover a weak outlook, unexpected event, or surprise news with eps and revenue announcement for the past quarter.
I use these websites and apps to aid in finding and research a company for a possible earnings related trade:
Yahoo! Earnings Calendar
Stock Scores Charting
Optionistics Option Charting
Stock Earnings
QuoteMedia News
App: Stock+Option: Real-Time Market All-in-One Station plus Options
App: Yahoo! Finance
The Hunt For The Earnings Trade
What companies are reporting this week? Which have high eps values reported historically? Which have decent enough option volume? Which companies have the highest probability of predicting an up or down stock movement? Which companies have charts with predictable pps patterns? There are many questions in my mind and so I begin the hunt.
To find a trading target I start with the Yahoo! Earnings Calendar.

I search through the days looking for companies I recognize in the news lately and with positive eps reporting historically. I think those two criteria help me narrow down long lists of companies reporting.
I decide to look at $DRI and $NAV more in-depth for 12/16/14 announcements. Next, I go to my Stock Station app and see both tickers charts. I’ll skip ahead here and will choose $DRI as the best trade target and document my analysis next.

$DRI’s chart looks like a nice uptrend. So I analyze it.
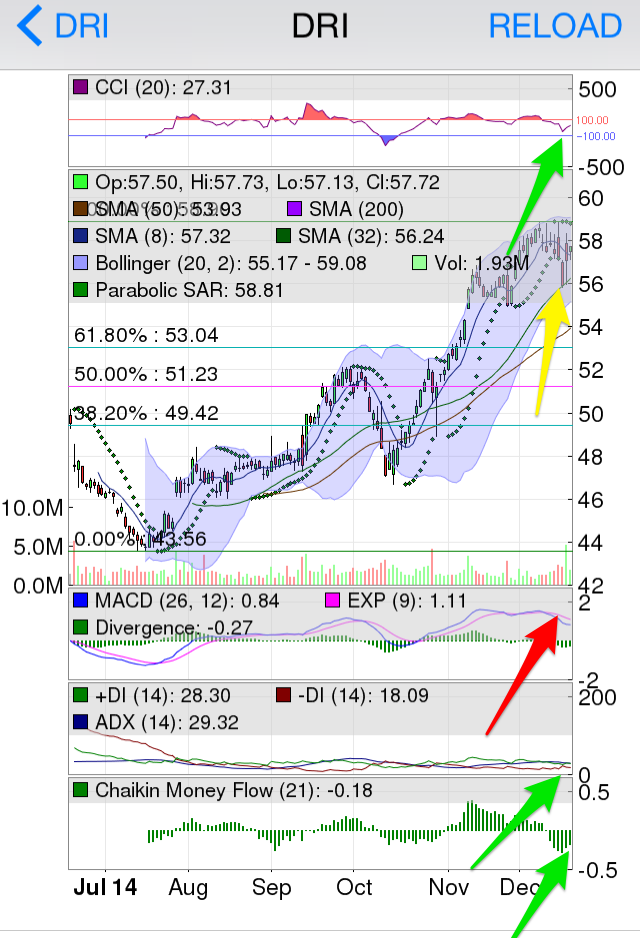
I can see some cautionary indications in the chart indicators. MACD is dipping showing buyer support waning. CCI is dipping also but possibly moving northward. The +DM and -DM are pretty close together, but +DM is above -DM with a decent ADX trend line (above 20).
Next, I search Stock Station’s option chain on $DRI. I look for decent open interest and some option volume that gives enough liquidity indication to make a possible trade.
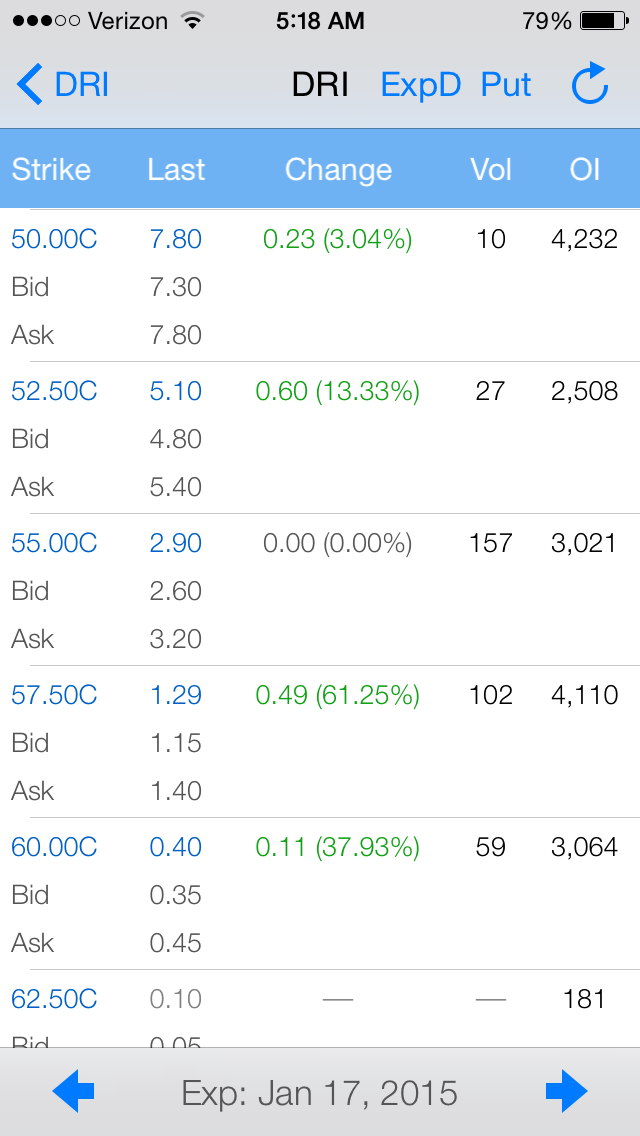

These snapshots of the 1/17/15 expy for $DRI Calls and Puts were taken 12/19/14, but a week ago volume was higher. Open interest has remained high. Option charts of $DRI Calls on optionistics.com show Calls pps value moving up.
With options looking liquid, I turn to the company’s earnings and revenue history. How often has it surprised and beat expectations? Stock Station offers a quick view of this data. $DRI has had a history of missing expectations.
Stock Station $DRI Earnings/Revenue History

Once I know I have an option possible trade and a decent company track record one way or another I then search for company news. I like to use QuoteMedia.com as it has a nice linear summary of news headlines and historical news links. Stock Station offers news references to various sources while in the app researching the many other stats of a company. The Yahoo! Finance app offers a more graphical view of company news.
Quote Media News

Yahoo! Finance News

Once I have a good feeling about the company’s earnings and revenue historical trends and possible trading sentiment of the company’s recent events and rumors I try to predict the pps trend before and after announcement.
Stock Scores $DRI 6-Month Chart

The Hunt Summary
+ Search for a ticker that is recognized from daily news reading and has positive earnings
+ $DRI was selected over $NAV due to a more predictable chart and higher option volume and open interest
+ $DRI’s chart showed a buy signal with CCI hitting a possible low point, +DM above -DM, and the pps candle hitting the BB center line and moving upward
+ $DRI’s news was positive about cost cutting and retail dining being better than expected in November.
I decide to trade Calls because of a buy signaling chart, Calls value and interest higher than Puts, and positive company news. These attributes outweigh the negative eps and revenue missed history for me.
Sometimes charts don’t predict an after announcement trend at all. This $HRB chart shows an uptrending pps but with an earnings and revenue miss the pps gaps down. An option trader holding Calls with mid-term expiration can weather this drop, and probably bet on $HBR’s longer term uptrend by holding.

This $PAY chart shows the pps downtrending into oversold territory and then bouncing after a positive eps and revenue beat of expectations. Unfortunately, the upper Bollinger Band restricts the pps movement as technical traders take profit. For an option trader holding Calls with strikes above $38 this means profit loss. A trader is reminded to be mindful of support and resistance when choosing an option strike in this example.

I hope this post helps traders gauge the risk and reward with the earnings strategy. With some research, analysis, and experience I think I can trade the earnings strategy with greater than a 50/50 chance of gains.
(Photo courtesy of and quick earnings strategy info at: Rich Dad stock blog)
