February 15, 2015
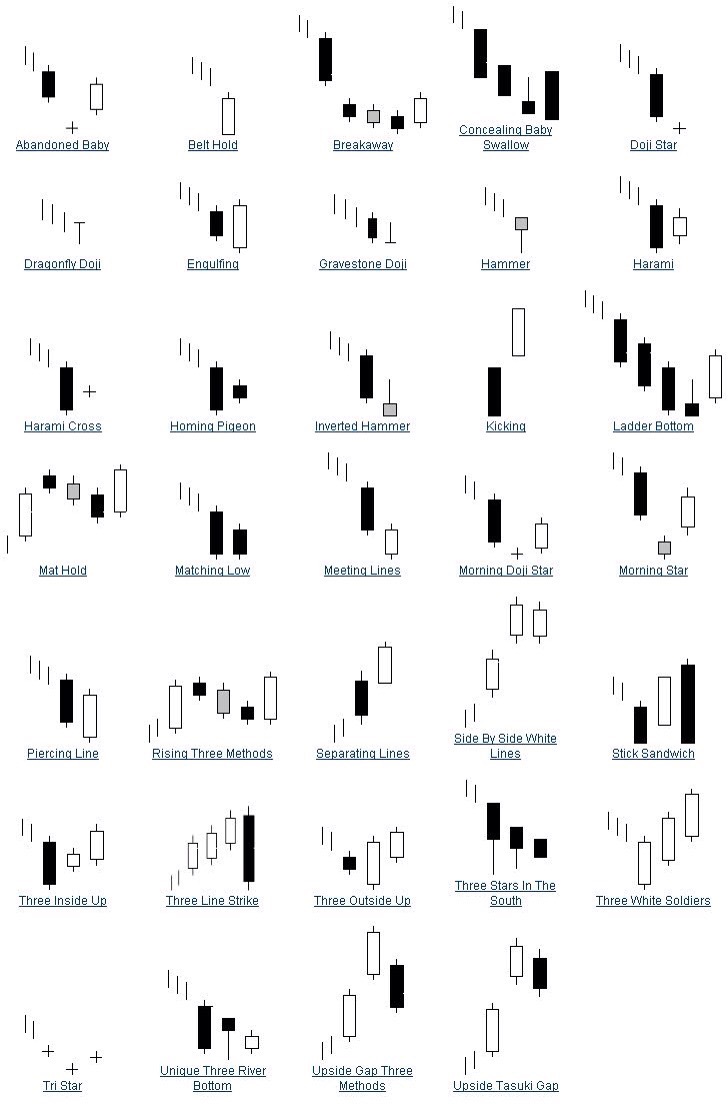
Chart patterns, a subset of technical analysis (TA) to me, are often the starting point for many traders. Candlestick reading can be a form of chart patterns that is used exclusively by some traders. There are other chart patterns that I’ll discuss next.
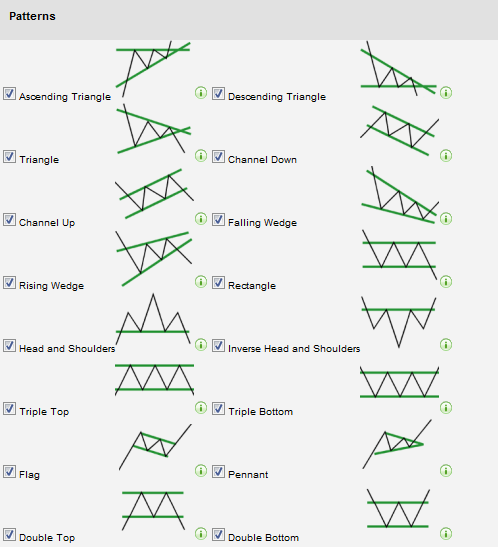
Greenwich Asset Management provides a visual for many patterns here.
Here’s an introduction to stock chart pattern analysis at StockCharts Chart School.
20 common chart patterns are discussed by StockCharts here.
If you want to go into crazy details regarding chart patterns see Thomas Bulkowski’s blog. Bulkowski has a book for sale titled Encyclopedia of Chart Patterns.
A trader I find who encompasses my TA sentiments at times is lowtrade at iHub. Lowtrade focuses on all stock types. Here’s lowtrade’s iHub 9/24/12 post on his trading strategy:
“Basically Chart patterns tell me what to play. TA supports a buy decision and resistance break triggers the entry.
TA indicators and overlays show change in the stocks momentum, volume, and trend. Entry/exit indicators I use are DMI and 5.10.20 MAs. Support indicators are Stoch, RSI and CMF. MOMO and volume, support trend change breakout entry/exit signals.
Chart patterns present target prices for breakout runs or retraces. And because of the historical relabilty of stocks preforming during chart patterns, the likely-hood a stock price will move in a certain direction increases. More so then charts without patterns.
Trading on technicals; I want a chart pattern first. That way I know the odds for a move are in my favor. Next I want positive TA indicators. That way I know retail sentiment is in my favor. And last I want good volume. That way I can expect increasing support for any breakout.
I teach study chart patterns 1st, TA indicators 2nd, and support/resistance 3rd. 4th understand how gaps effect future.”
Lowtrade has quite a trader following on his iHub board lowtrade. One of his stickies redirects to his lowtrade study guide title Welcome To My Mind here.
Lowtrade categorizes a penny stock as on the OTC, but can be categorized differently among traders and groups. Some trade OTC tickers under a certain dollar pps value. Some trade big exchange, which I coin ANN tickers (AMEX, NASDAQ, or NYSE), penny tickers exclusively. I’ve seen the penny stock value limit set at $10, $5, or $1 and below. I’ve also seen penny stocks categorized by their market capitalization which is the pps times outstanding shares. Some categorize market caps as micro starting at $200 million, $100 million, or $50 million. I coin a penny stock as a pps $10 or less to keep it simple. Lowtrade ends his trading strategy with making sure enough trading volume exists. ANN tickers generally offer more liquidity, or money coming in from traders, and transparency to push dollar trading volumes generally higher than OTC tickers.
I find chart analysis to better predict pps trends with tickers that have high volume and trading dollar valuedaily. Big boards, or ANN is I call the Exchanges, have more tickers with these requirements. Chart analysis isn’t only important for equity entry and exit decisions, as once a trader knows a predicted pps trend then underlying stock/ETF options can be traded. Calls are for predicted uptrends while Puts are for predicted downtrends.
Here are a few more basic patterns including candlestick patterns.