
June 30, 2014
Do you enjoy trading on the go? Trading via mobile has become the latest trend and many apps have appeared to fill a trader’s need. My repertoire includes almost 100 stock trading apps. One of my most utilized iPhone trading apps is Stock Station.
What follows are screenshots and short descriptions of each. Stock Station offers stock charting, watch lists, portfolio tracking, ticker news, pre-populated and custom screeners, stock/ETF option chains and light graphs, company research, and a ticker alert feature. Stock Station is a powerful tool to add to a trading arsenal for $40.
The opening screen brings a user to most areas of the app: Watchlist, alerts, screeners, daily hotlist, market movers, unusual volume and more. Note the four icons on the bottom. For quick ticker specific research click the Research magnify glass icon. You can also quickly check your portfolio via the Portfolio pie chart icon.

The Screen feature allows a user to create custom ticker screeners via many popular indicators such as RSI, MAs, patterns, and etc. a user can also screen by fundamental statistics.

The Hotlist is pre-populated scans that are technical, candlestick pattern, and options oriented. These scans are comparable to many other trading apps that specialize in on of these scan types only.

The Market Mover screener is great for day traders looking for tickers with volume and price momentum. I find these scans to be better than free scans on brokerage free apps and desktop software.

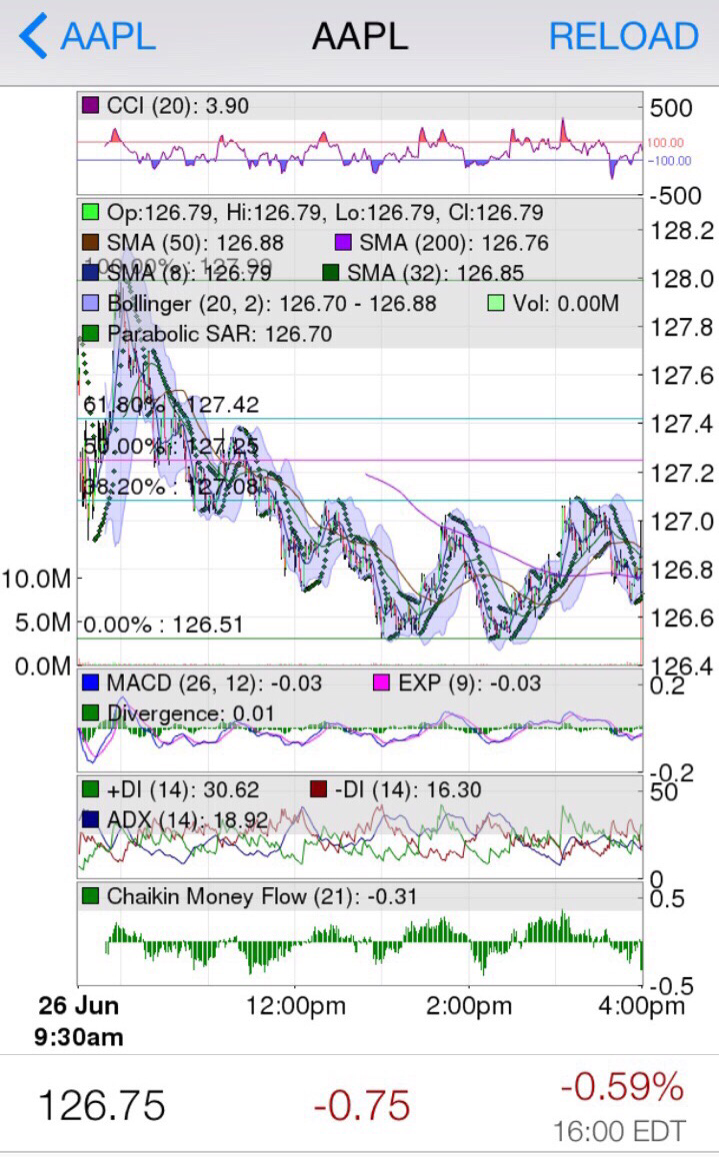
A user’s first view of a ticker in Stock Station starts with the quote and stock chart that can be customized for pps line, candle, or bar.

The features available at the initial ticker research screen are greatly larger than most trading apps. Charting, custom charting, news, company info, company filings, insider holdings, short interest, analyst ratings, institutional and ETF holdings, competitors, earnings and dividend info with dates, option chains and graphs, and alerts allow quick ticker research in one place to become a reality.
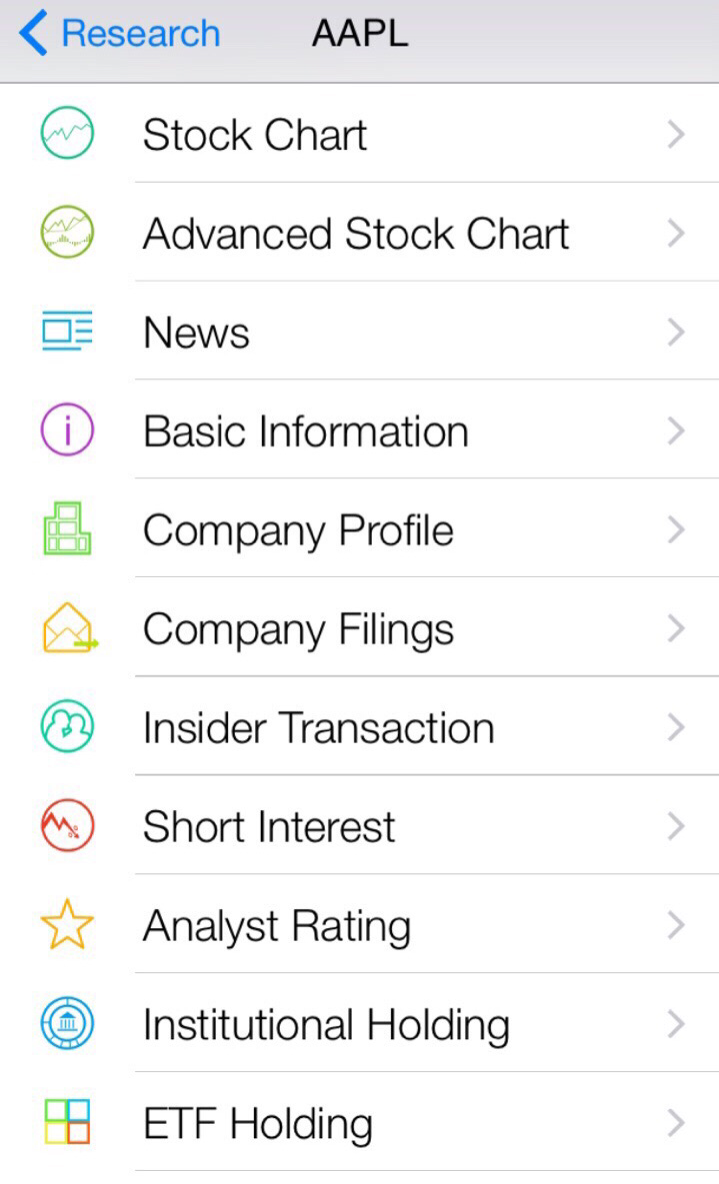
The first Stock Chart option allows up to two indicators to be added. This chart feature is a basic start but allows quicker analysis and set up for other tickets viewed in the future. I like to use a different period and indicator mix here than in the Advance Chart feature shown next.

The Advanced Chart feature allows up to four indicators , four moving averages, and four overlays to be applied in one chart. This feature alone is tough to find in most mobile charting apps. Charts are clear given the number of analysis points shown at one time.


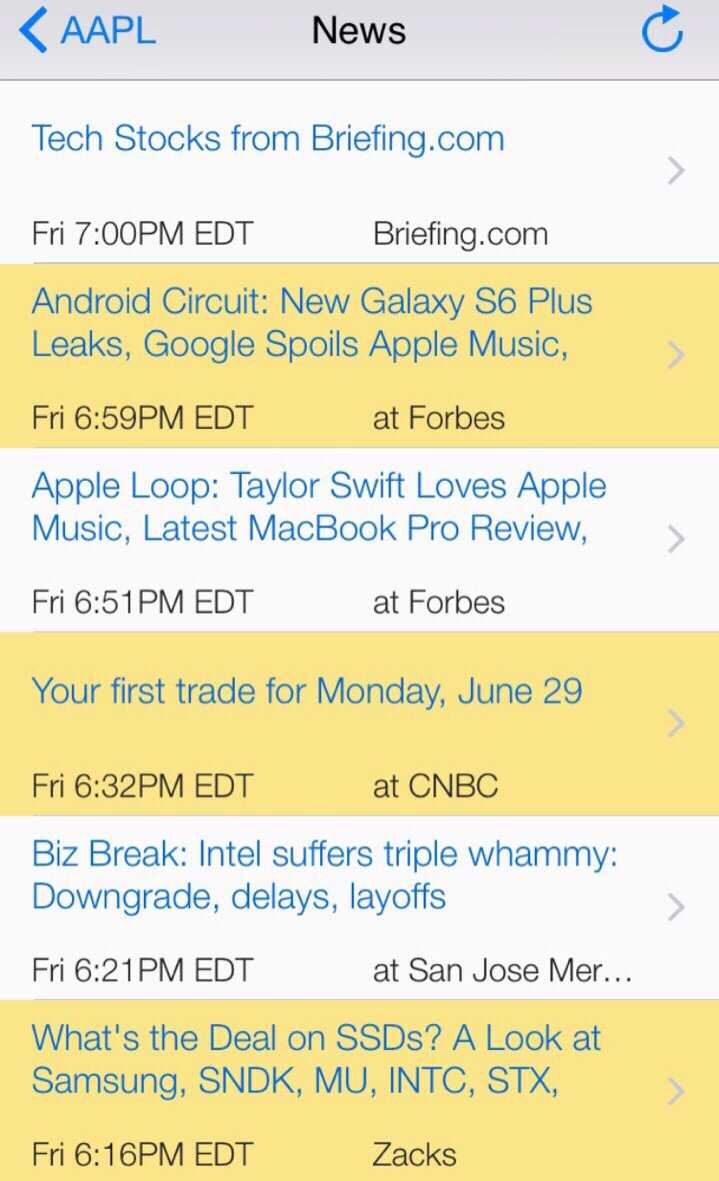
Ticker News is a quick way to view recent company news. I’ve found the news sources to be pretty varied and at times I find an article in Stock Station not shown in other trading apps or with my brokerage basic company news feature.
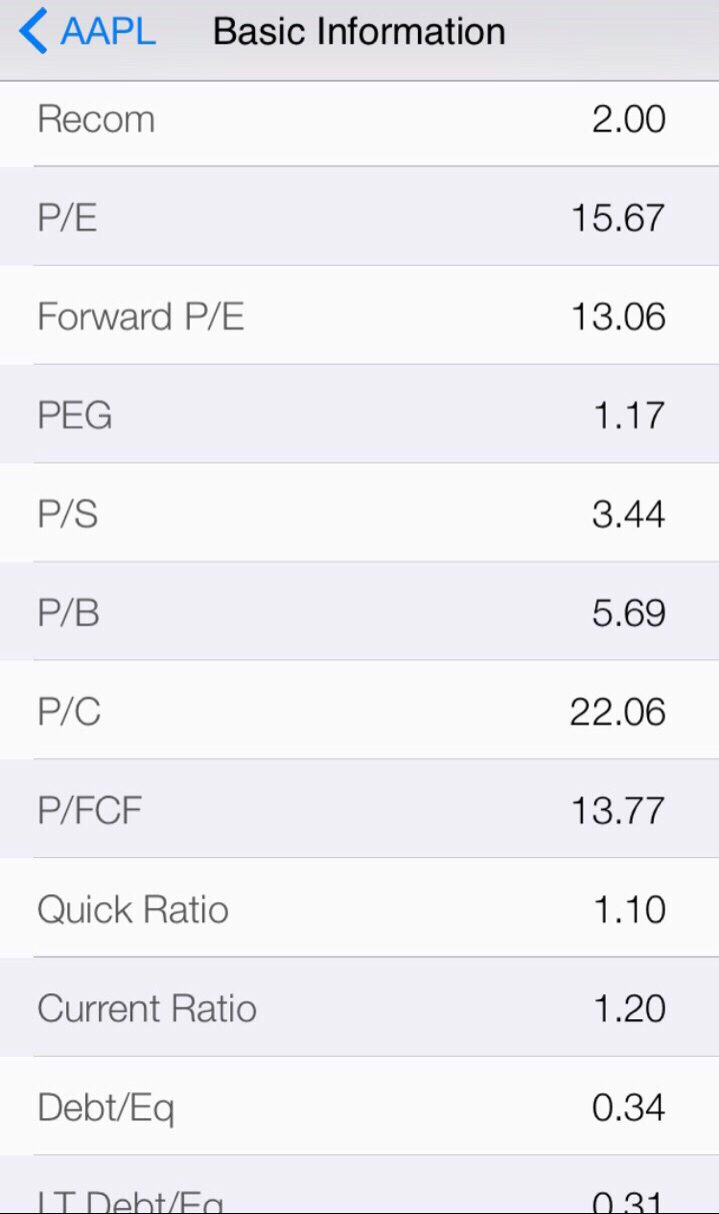
Basic Information provide company stats in one quick viewing point. Unlike Yahoo! Finance and NASDAQ.com, this view is in text format that doesn’t require multiple tabs or links to be navigated.


Company Profile gives a quick company synopsis to get a basic idea of what a company does.

Company Filings can be found at SEC.gov but how about within your trading app? I find Stock Station’s filing format to allow quick identification of forms for the current year.

Officers and managers of a company who hold shares are shown in the Insider Transaction section. Many traders watch whether more insiders are buying or selling to gauge management’s sentiment of its company.

Institutional Holding is an important metric to consider when trading blue chip to small cap companies. Trading professionals In hedge funds, mutual funds, pension funds, and other large financial organizations that manage large holdings, possibly in your target company, can point to a direction you’ve been predicting via your own research.

Exchange traded funds (ETF) are like mutual funds except can be traded multiple times in a day and can be possibly optionable. Many call ETFs mutual funds 2.0 because the benefits and tradibility are better than with traditional mutual funds. Stock Station provides a handy section to show what percentage of holdings an ETF has in your target ticker.

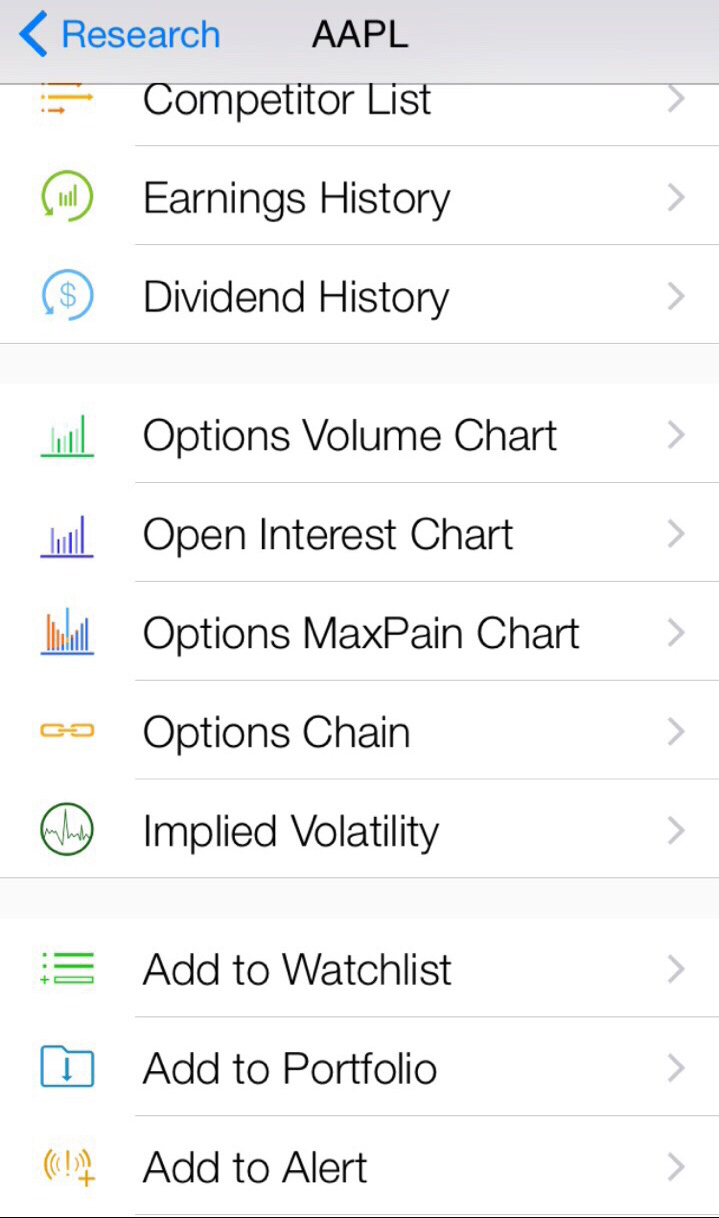
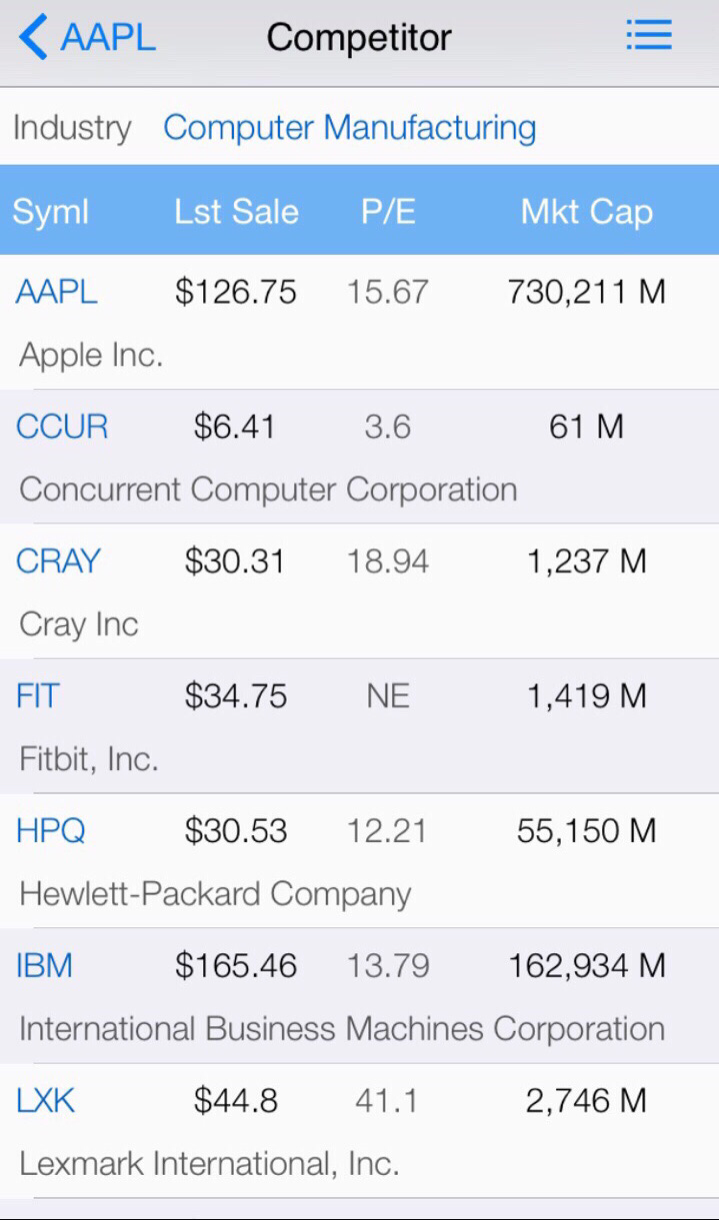
How are competitors doing in contrast to a target ticker? Competitor analysis is important because it can show how a target company is performing versus industry leaders or how competition might be changing in the future for a market leader. The simple comparisons of P/E and market cap are a start.
Earnings are a metric of performance for a company. Earning release (ER) lets investors/traders know how the company is doing and what management perceives the future to hold. Many tickers’ pps move with ER announcement.

Options are contracts that give holders the right to exercise for shares (10 for mini and 100 for regular option contracts) by a set future date called expiration. Options can be traded for speculation or as a hedge to a current long-term stock/ETF hold.
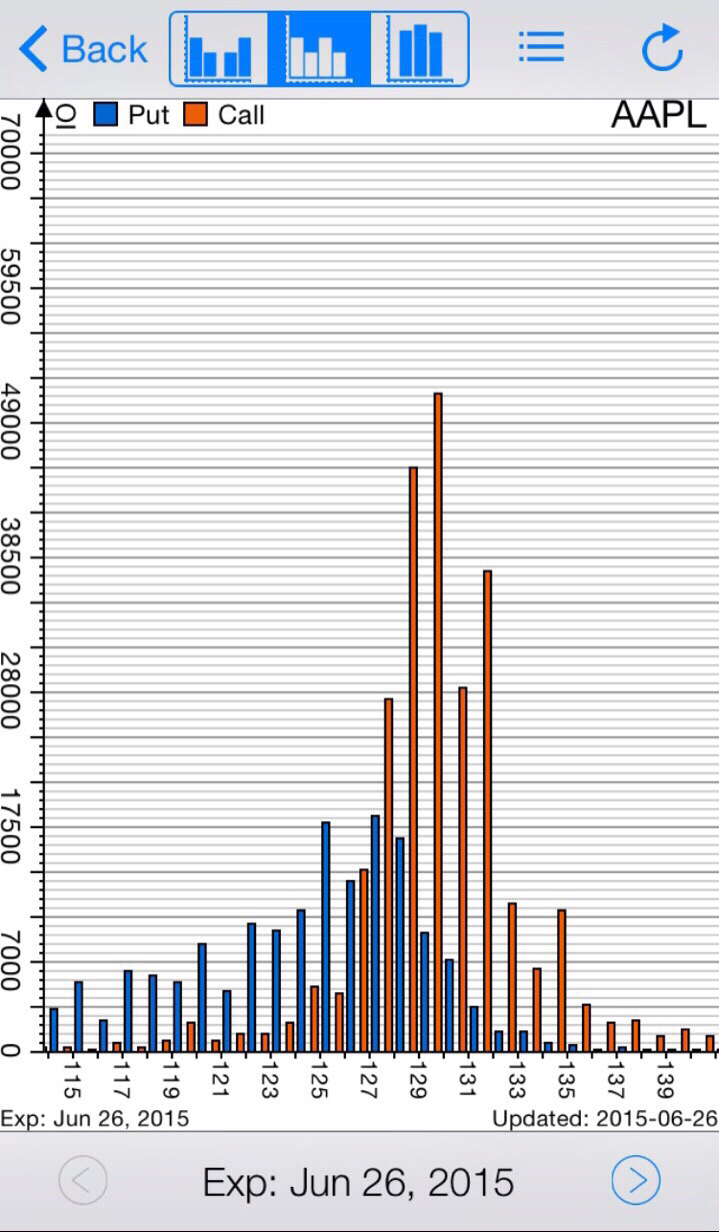
Stock Station offers option volume and open interest bar graphing visual metrics to aid a trader’s gauge of option interest.

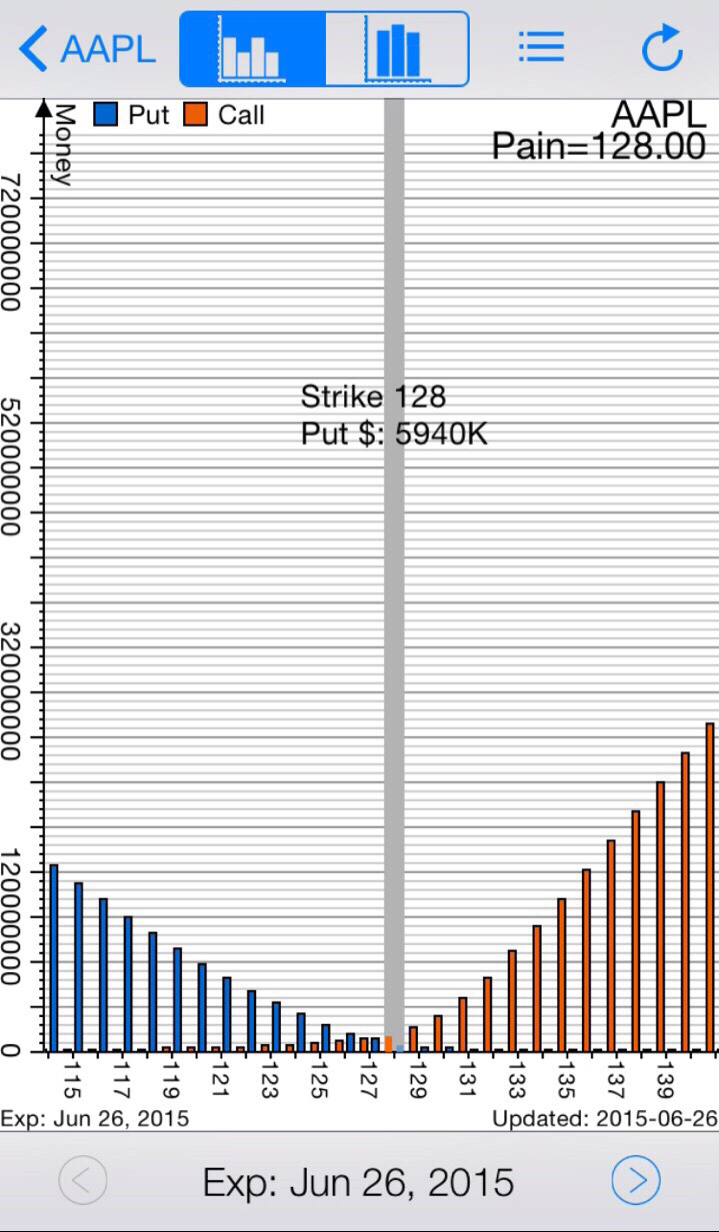
The Max Pain option bar chart tells a trader the point where the maximum pain can be felt via money loss from option trading. This Benzinga 2014 article can help with quick education on the Max Pain theory.
Implied Volatilty is one aspect of option pricing. Being on the right side of implied volatility is important to not loss gains or initial investment. This Investopedia article offers insights into option pricing and implied volatility.

Our final Stock Station image is of an Option Chain. Stock Station’s presentation is unique in that it shows volume, open interest, and option pps change in the same screen.

I hope this Stock Station review shows the power of this single iPhone app and provides increased trading knowledge to you the reader. Feel free to post your thoughts!
